APM(어플리케이션 모니터링 툴) *datadog
- 트랜잭션을 로그화
Flow

- 대부분의 모니터링 도구가 Push 방식(각 서버에 클라이언트 설치, 클라이언트가 메트릭 데이터를 수집해 서버로 보내면 서버가 모니터링 상태를 보여주는 방식)
- Prometheus는 Pull 방식(서버에 클라이언트가 떠 있으면 서버가 주기적으로 클라이언트에 접속해 데이터를 가져오는 방식)
- Exporter, Prometheus Server, Grafana, Alertmanager로 구성됨
- ExporterExporter를 실행하면 데이터를 수집하는 동시에 HTTP 엔드포인트를 열어서(기본은 9100 포트) Prometheus 서버가 데이터를 수집해 갈 수 있도록 한다. 이 말은 웹 브라우저 등에서 해당 HTTP 엔드포인트에 접속하면 Metric의 내용을 볼 수 있다는 의미이다.*웹 애플리케이션 서버 같은 경우의 Metric은 클라이언트 라이브러리를 이용해서 Metric을 만든 후 커스텀 Exporter를 사용할 수 있다.
- *Exporter를 쓰기 어려운 배치잡 등은 Push gateway를 사용
- 모니터링 대상의 Metric 데이터를 수집하고 Prometheus가 접속했을 때 정보를 알려주는 역할
Prometheus Server
Expoter가 열어놓은 HTTP 엔드포인트에 접속해서 Metric 수집
Alertmanager
알림을 받을 규칙을 만들어서 Alert Manager로 보내면 Alert Manager가 규칙에 따라 알림을 보낸다.
Ncloud - OCI 멀티클라우드 통합 모니터링
Ncloud - 퍼블릭 서버에 메트릭서버 만듬
Oracle cloud - 퍼블릭 서버에 node export 수집 서버 만듬
(참고) 프로메테우스의 표현식 언어
수집한 매트릭 데이터를 조회할 수 있는 함수형 표현식 언어를 제공
- 이 표현식 언어로 매트릭 데이터를 실시간으로 조회
- 셀렉트 박스로 특정 매트릭을 선택해서 데이터나 그래프 확인
process_cpu_seconds_total, node_cpu, http_requests_total 등을 인스턴스 벡터라고 부른다. 이 인스턴스 벡터로 쿼리를 할 수 있다.
인스턴스 벡터 뒤에 { }로 레이블을 지정하면 필터링 가능
- http_requests_total{job="prometheus",group="canary"}와 같이 사용가능
- ex) node_cpu_seconds_total에서 job 이름이 node_exporter인 정보만 조회
- 레이블에서는 =, !=, =~, !~같은 논리연산자를 사용가능(~는 정규표현식 비교)
- 인스턴스 벡터 뒤에 레인지 벡터라고 부르는 []를 사용가능
- http_requests_total{job="prometheus"}[5m]라고 하면 최근 5분의 값을 조회
- 오프셋 모디파이어: node_cpu offset 10m처럼 특정 시간의 값을 조회
메트릭을 수집하기 위한
Prometheus 설치
모니터링 수집 서버 (Public Subnet)
# 소스 파일 관리
mkdir /tmp/prometheus
cd /tmp/prometheus

# 프로메테우스 다운로드
wget https://github.com/prometheus/prometheus/releases/download/v2.43.0/prometheus-2.43.0.linux-amd64.tar.gz

# 프로메테우스 압축 해제
tar -zvxf prometheus-2.43.0.linux-amd64.tar.gz

# sysctl 에 등록  : 설정파일과 동시 실행
sudo vim /etc/systemd/system/prometheus.service

# 내용 추가
[Unit]
Description=Prometheus
After=network.target

[Service]
ExecStart=/tmp/prometheus/prometheus-2.43.0.linux-amd64/prometheus --config.file /tmp/prometheus/prometheus-2.43.0.linux-amd64/prometheus.yml
Restart=always
StartLimitBurst=0
Restart=on-failure

[Install]
WantedBy=default.target


# sysctl 서비스 등록
sudo systemctl daemon-reload
sudo systemctl enable prometheus
sudo systemctl start prometheus

# 프로메테우스 동작 확인
sudo systemctl status prometheus

curl localhost:9090
<a href="/graph">Found</a>.
public ACG 수정 - 9090 추가
http://[public server IP]:9090/
http://[public server IP]:9090/metrics
node-exporter: 서버의 CPU, 메모리, 디스크 등의 상태를 모니터링
매트릭을 제공하는 Exporter, 매트릭을 수집하고 이를 HTTP 엔트포인트로 Prometheus에 노출하는
node_exporter 설치
nat gateway 생성
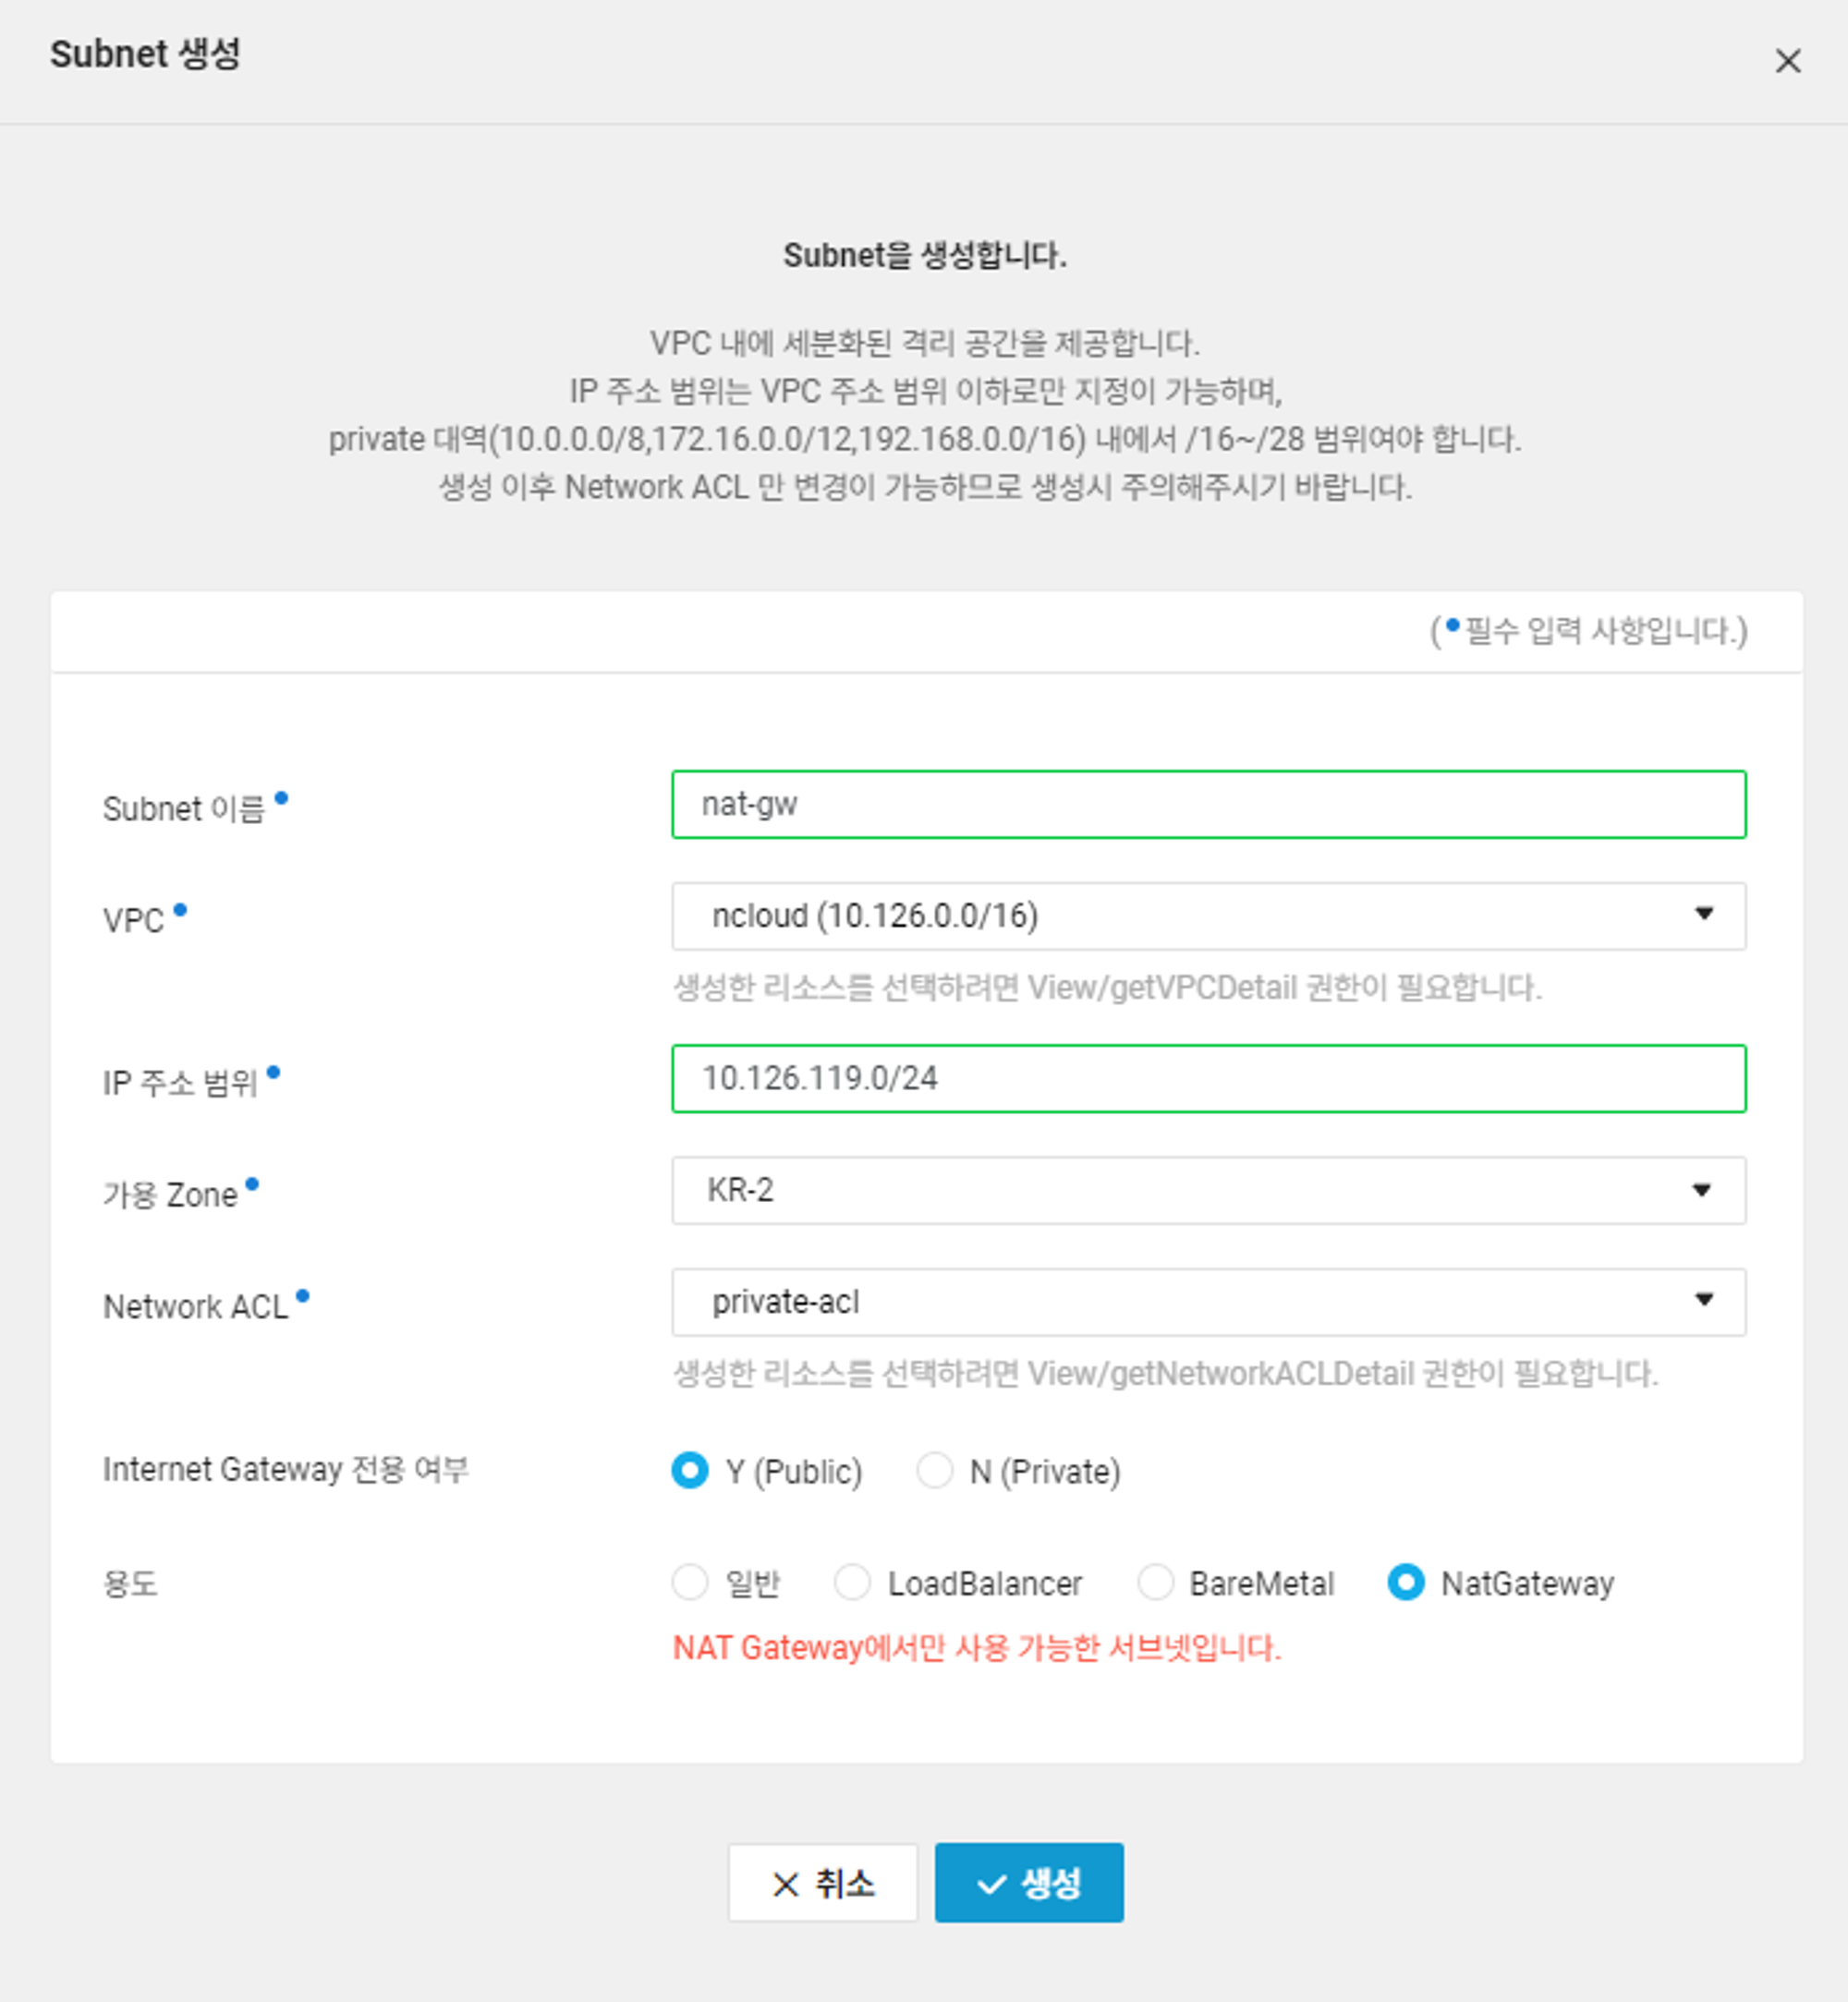
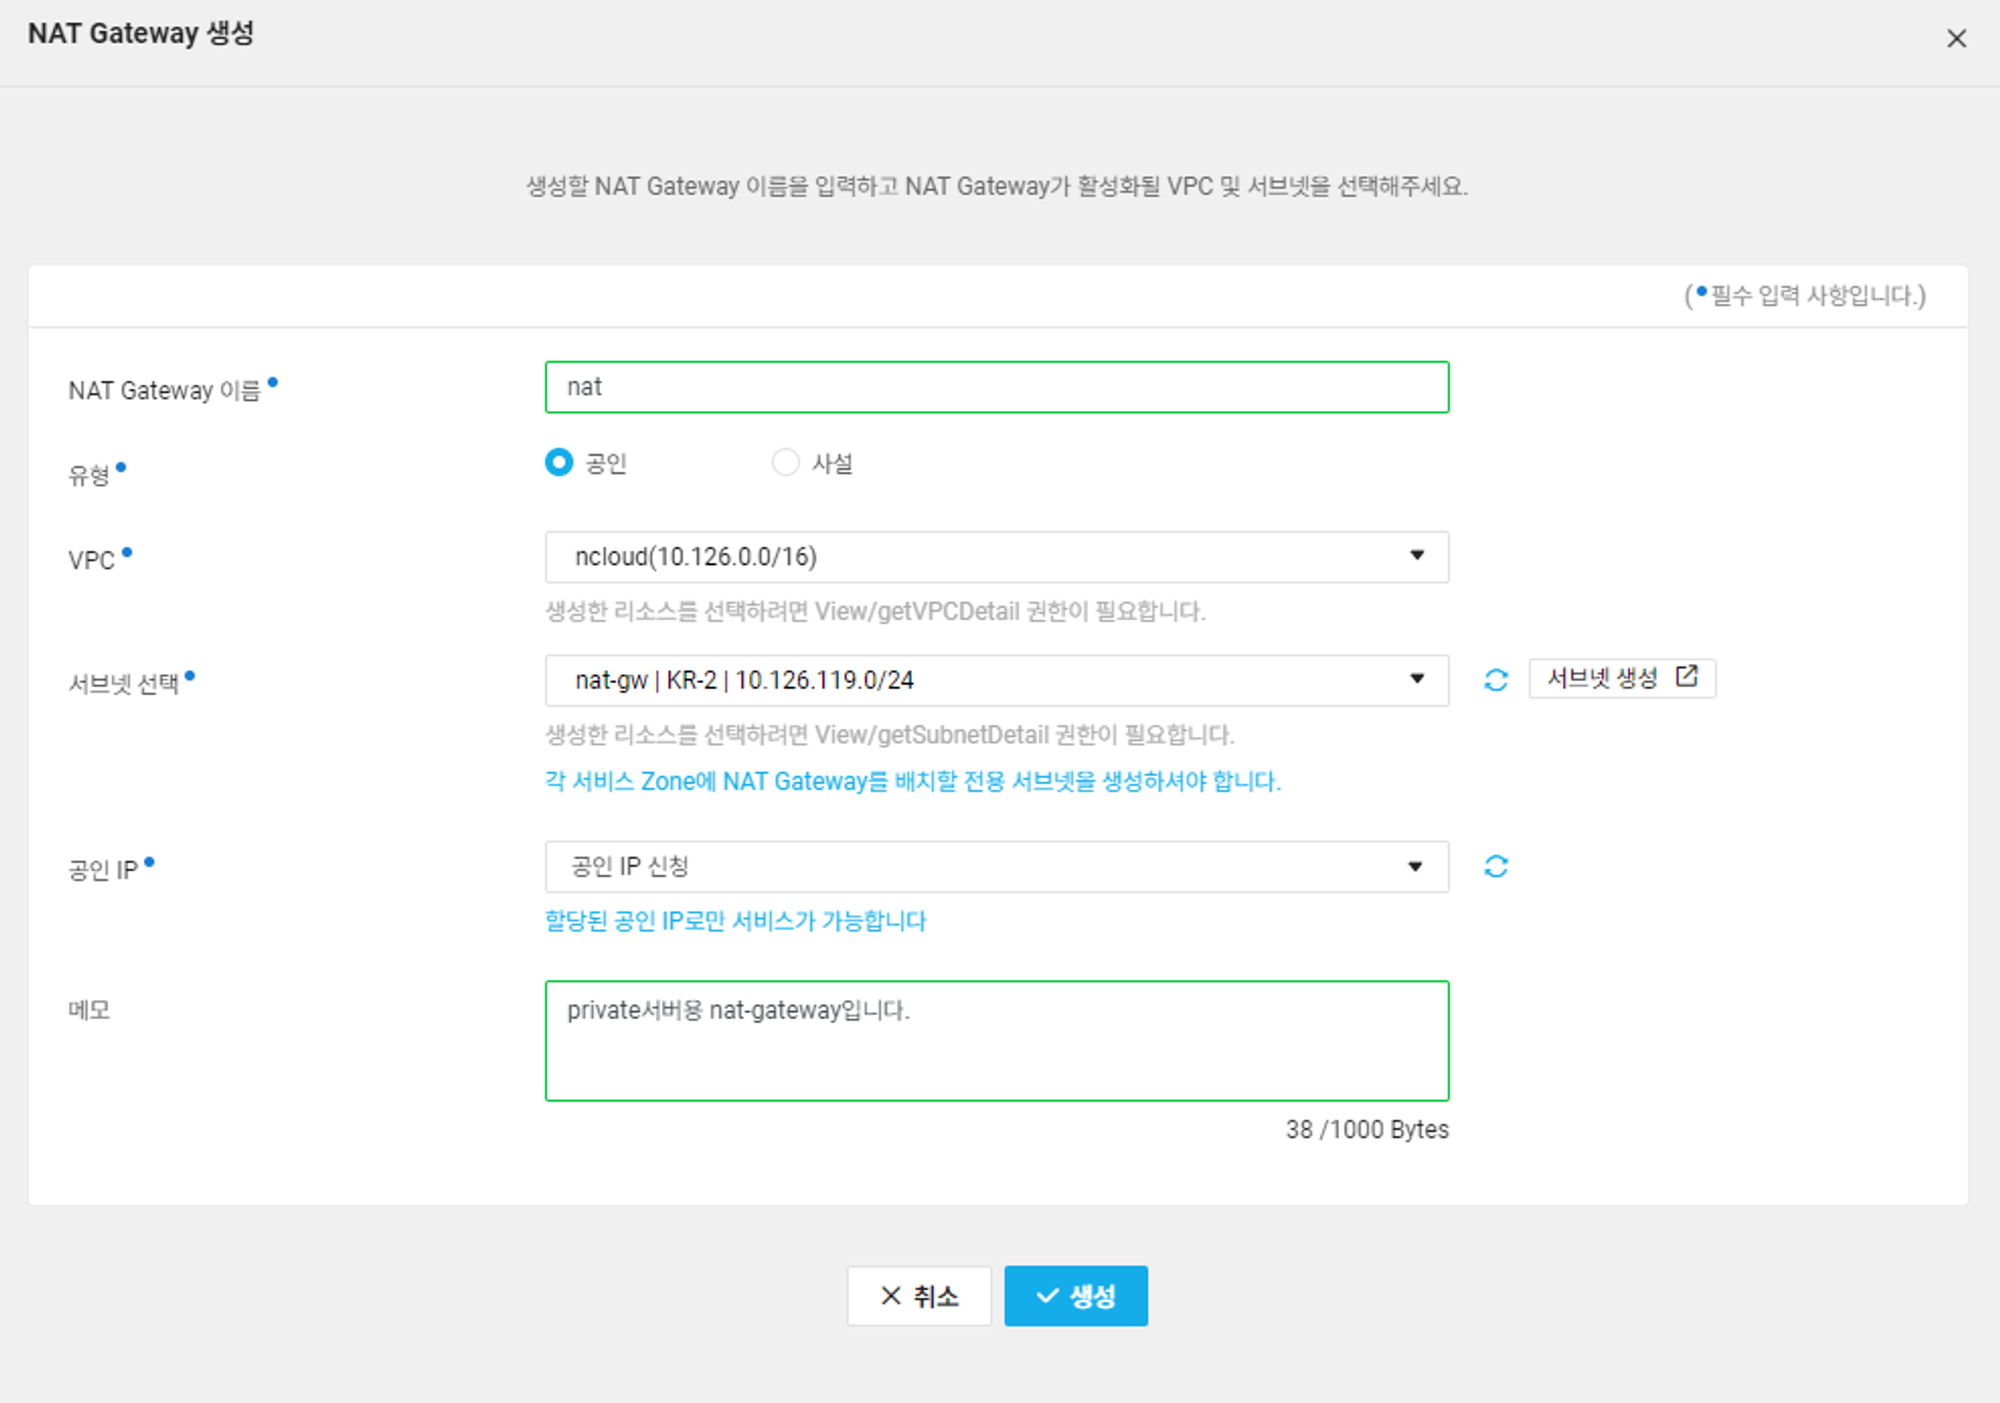
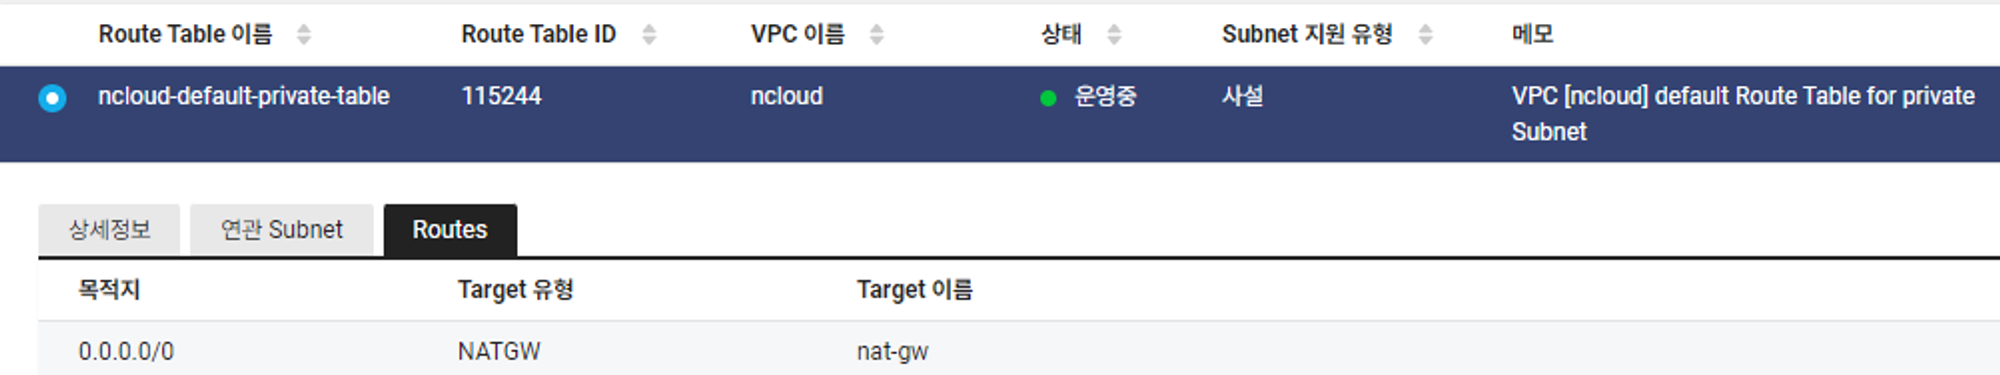
모니터링 타겟 서버(Private Subnet)
# 소스 파일 관리
mkdir /tmp/prometheus-node
cd /tmp/prometheus-node


# 프로메테우스 node-exporter 설치
wget https://github.com/prometheus/node_exporter/releases/download/v1.5.0/node_exporter-1.5.0.linux-amd64.tar.gz


# 압축해제
tar -zvxf node_exporter-1.5.0.linux-amd64.tar.gz


# sysctl 에 등록
sudo vim /etc/systemd/system/prometheus-node.service

# 내용 추가
[Unit]
Description=Prometheus-node
After=network.target

[Service]
ExecStart=/tmp/prometheus-node/node_exporter-1.5.0.linux-amd64/node_exporter
Restart=always
StartLimitBurst=0
Restart=on-failure

[Install]
WantedBy=default.target


# sysctl 서비스 등록
sudo systemctl daemon-reload
sudo systemctl enable prometheus-node
sudo systemctl start prometheus-node

# 프로메테우스 동작 확인
sudo systemctl status prometheus-node
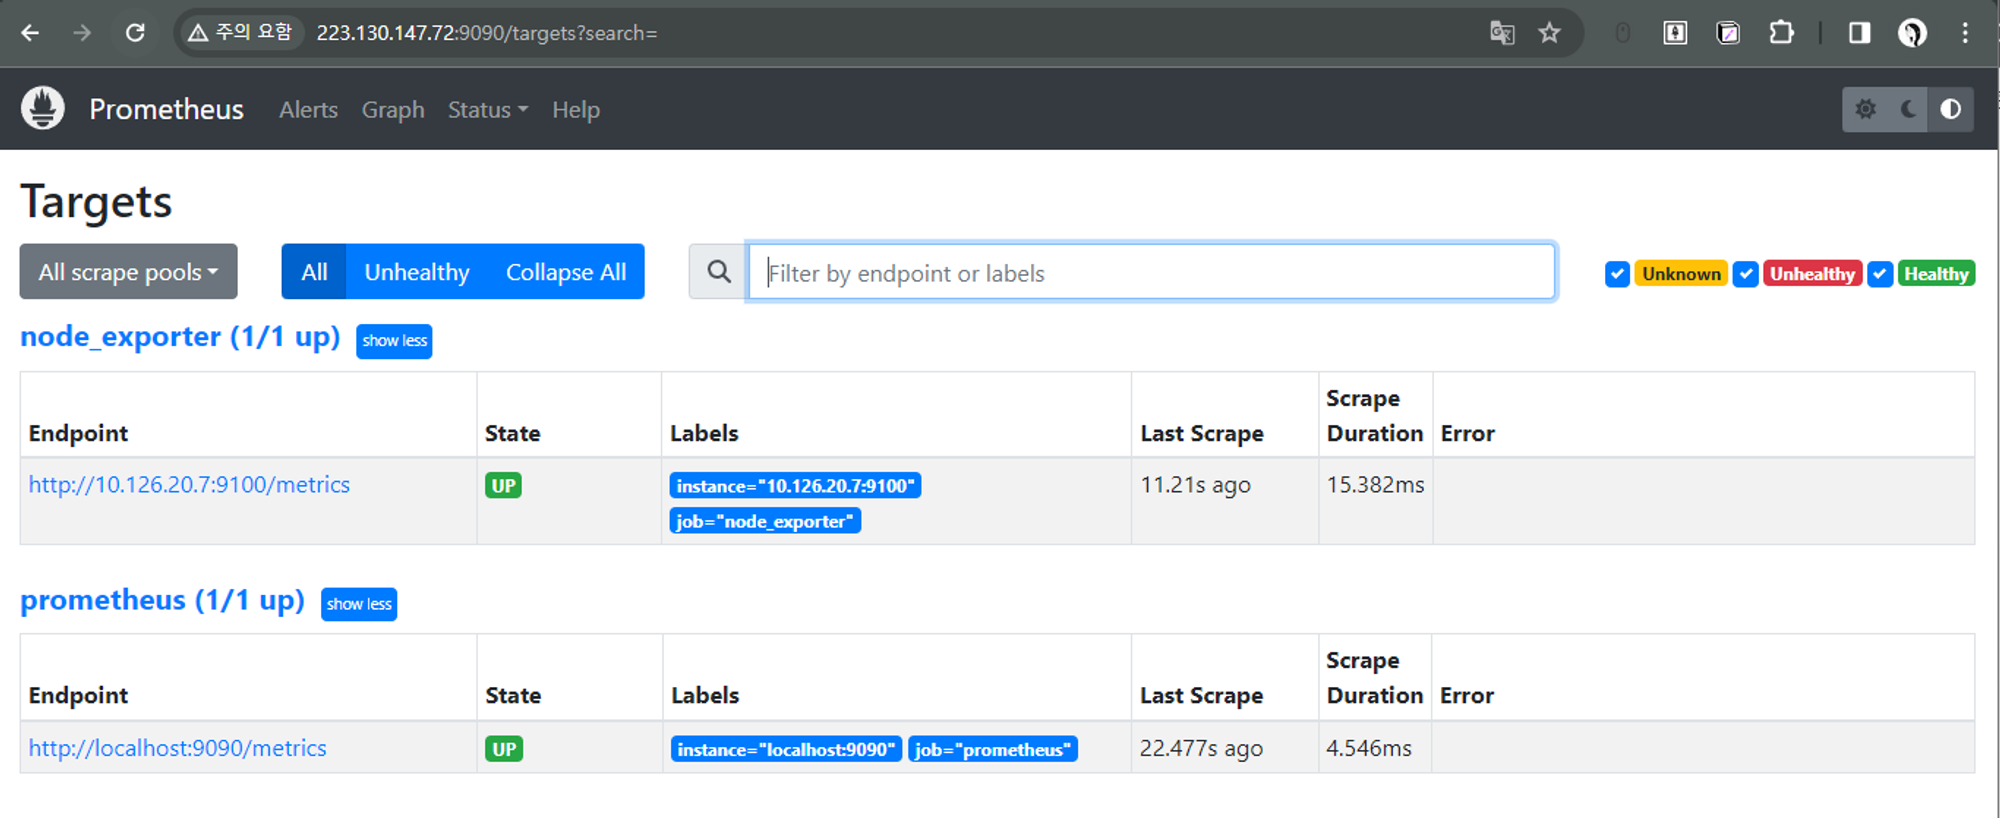
모니터링 서버에 타겟 서버 등록(public)
prometheus.yml: Prometheus 서버를 띄울 때 사용한 설정 파일
- scrape_configs: 리스트로 표현
- scrape_config_files: 파일로 설정 가능
# 설정 값 수정
cd /tmp/prometheus/prometheus-2.43.0.linux-amd64
vim prometheus.yml

# 설정 값 하기 수정

# 매트릭 수집을 위한 전역설정 값
global:
  scrape_interval: 15s # 15초마다 매트릭을 수집한다. 기본은 1분
  evaluation_interval: 15s # 15초마다 규칙을 평가한다. 기본은 1분.
  # scrape_timeout is set to the global default (10s).

# Alertmanager configuration
alerting:
  alertmanagers:
    - static_configs:
        - targets:
          # - alertmanager:9093

# 규칙을 로딩하고 'evaluation_interval' 설정에 따라 정기적으로 평가한다
rule_files:
  # - "first_rules.yml"
  # - "second_rules.yml"

# 매트릭을 수집할 엔드포인드
scrape_configs:
  # 이 설정에서 수집한 타임시리즈에 `job=<job_name>`으로 잡의 이름을 설정한다.
	# targets: Prometheus서버가 접근해서 데이터를 가져올 Exporter의 HTTP 엔드포인트
  - job_name: 'prometheus'
    static_configs:
      # metrics_path의 기본 경로는 '/metrics'이고 scheme의 기본값은 `http`다
      - targets: ['localhost:9090'] # 기본값, metrics_path를 이용해서 localhost:9090/metrics에 접근해서 데이터를 가져온다.
                                    # Prometheus 서버가 매트릭을 수집하는 서버인 동시에 매트릭을 노출하는 Exporter
  - job_name: 'node_exporter'
    scrape_interval: 1s
    static_configs:
      - targets: ['[타겟서버 IP]:9100']


# 프로메테우스 재시작
sudo systemctl restart prometheus
프로메테우스 서버를 프로메테우스 서버에 연결하거나 Alert Manager 등에서 이 서버의 데이터를 가져갈 수 있는데 그때 구분할 수 있도록 external_labes로 이름을 지정할 수 있다.
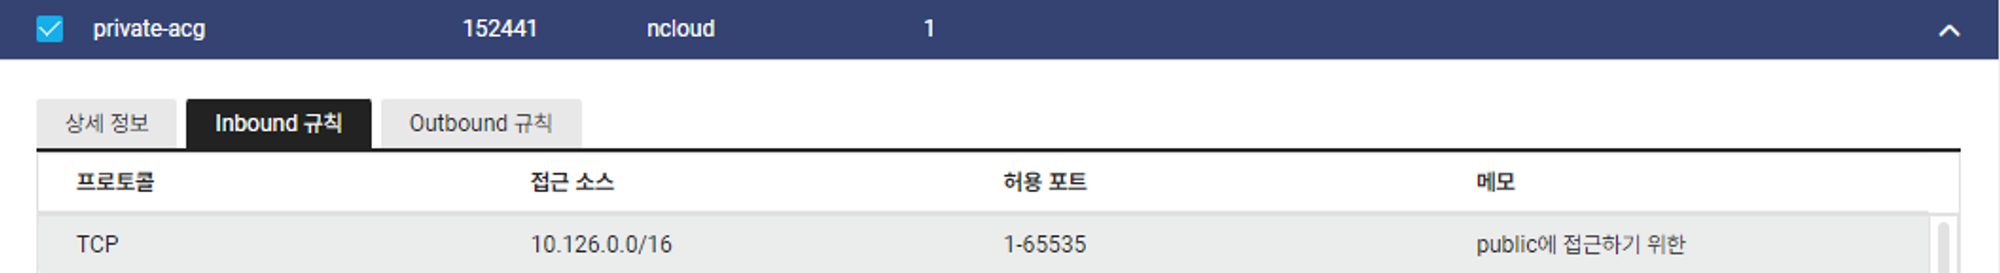
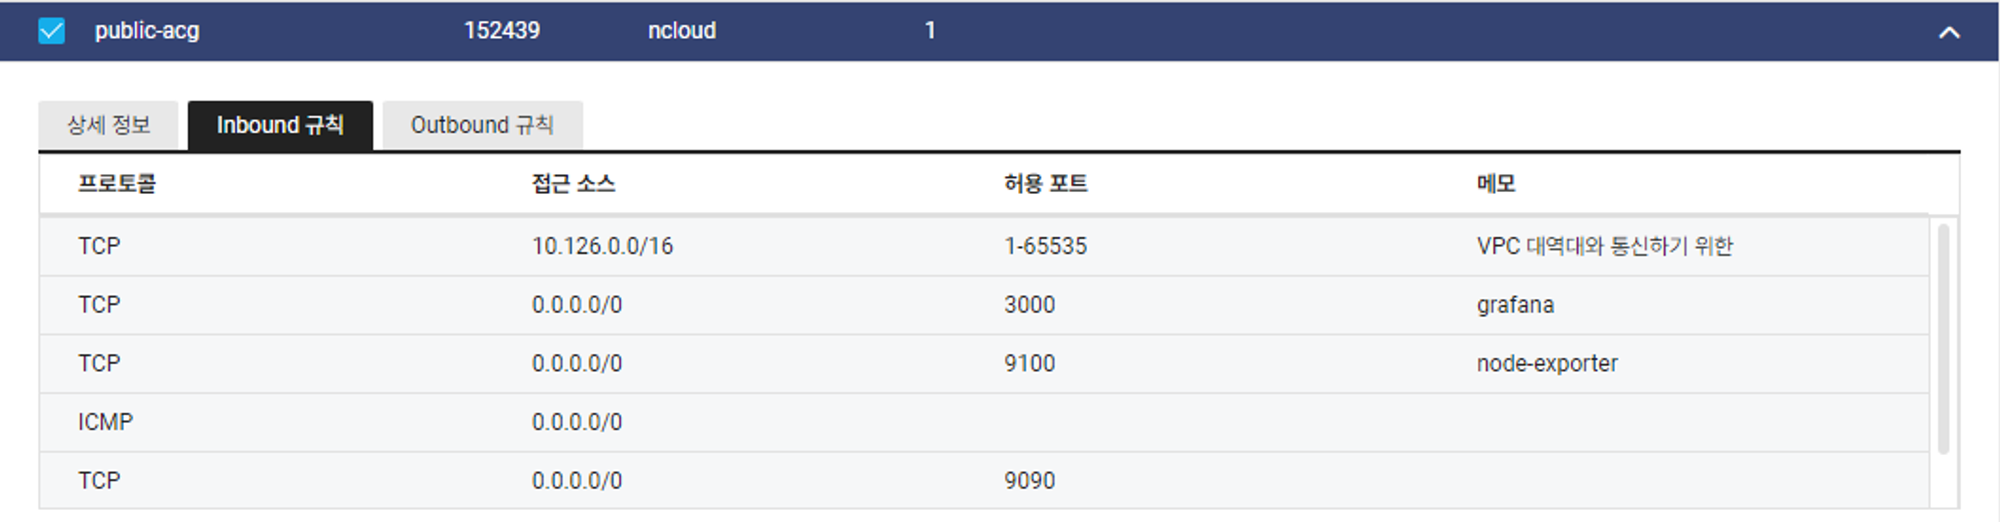
ACG
private서버에서 퍼블릭으로 통신하기 위해 VPC 대역대를 오픈해준다.
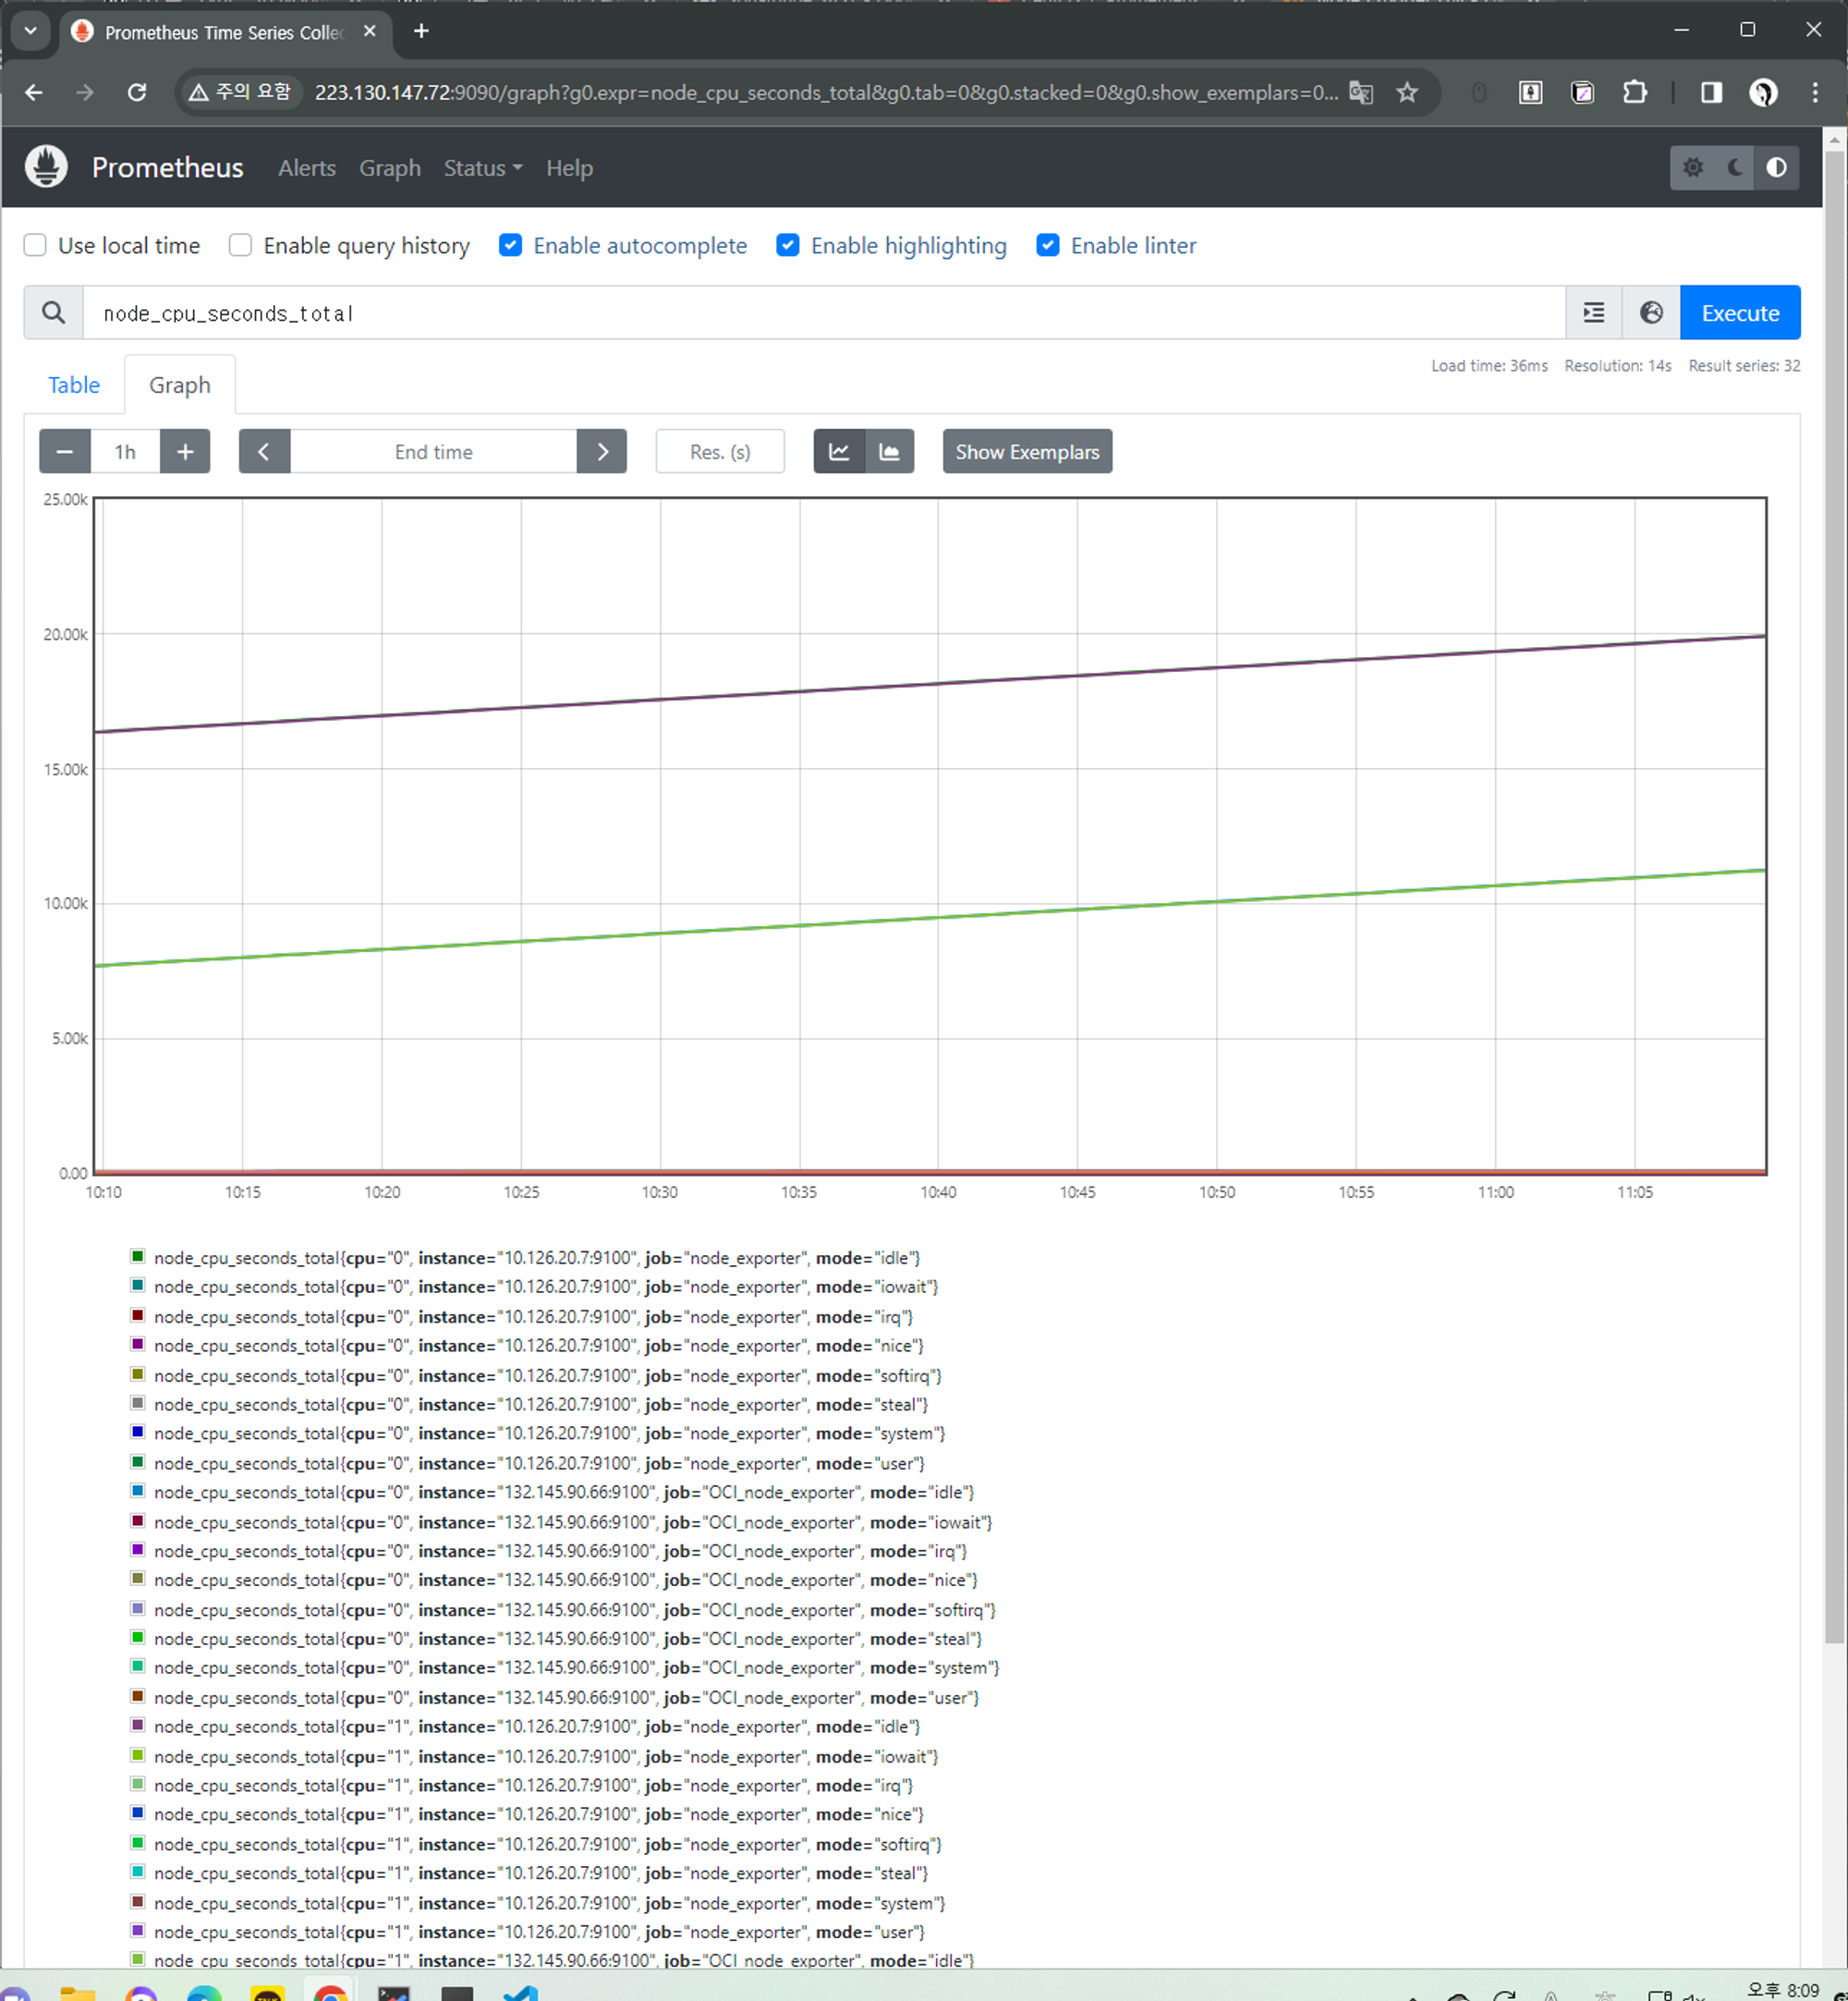
ex) cpu 메트릭을 수집한 그래프
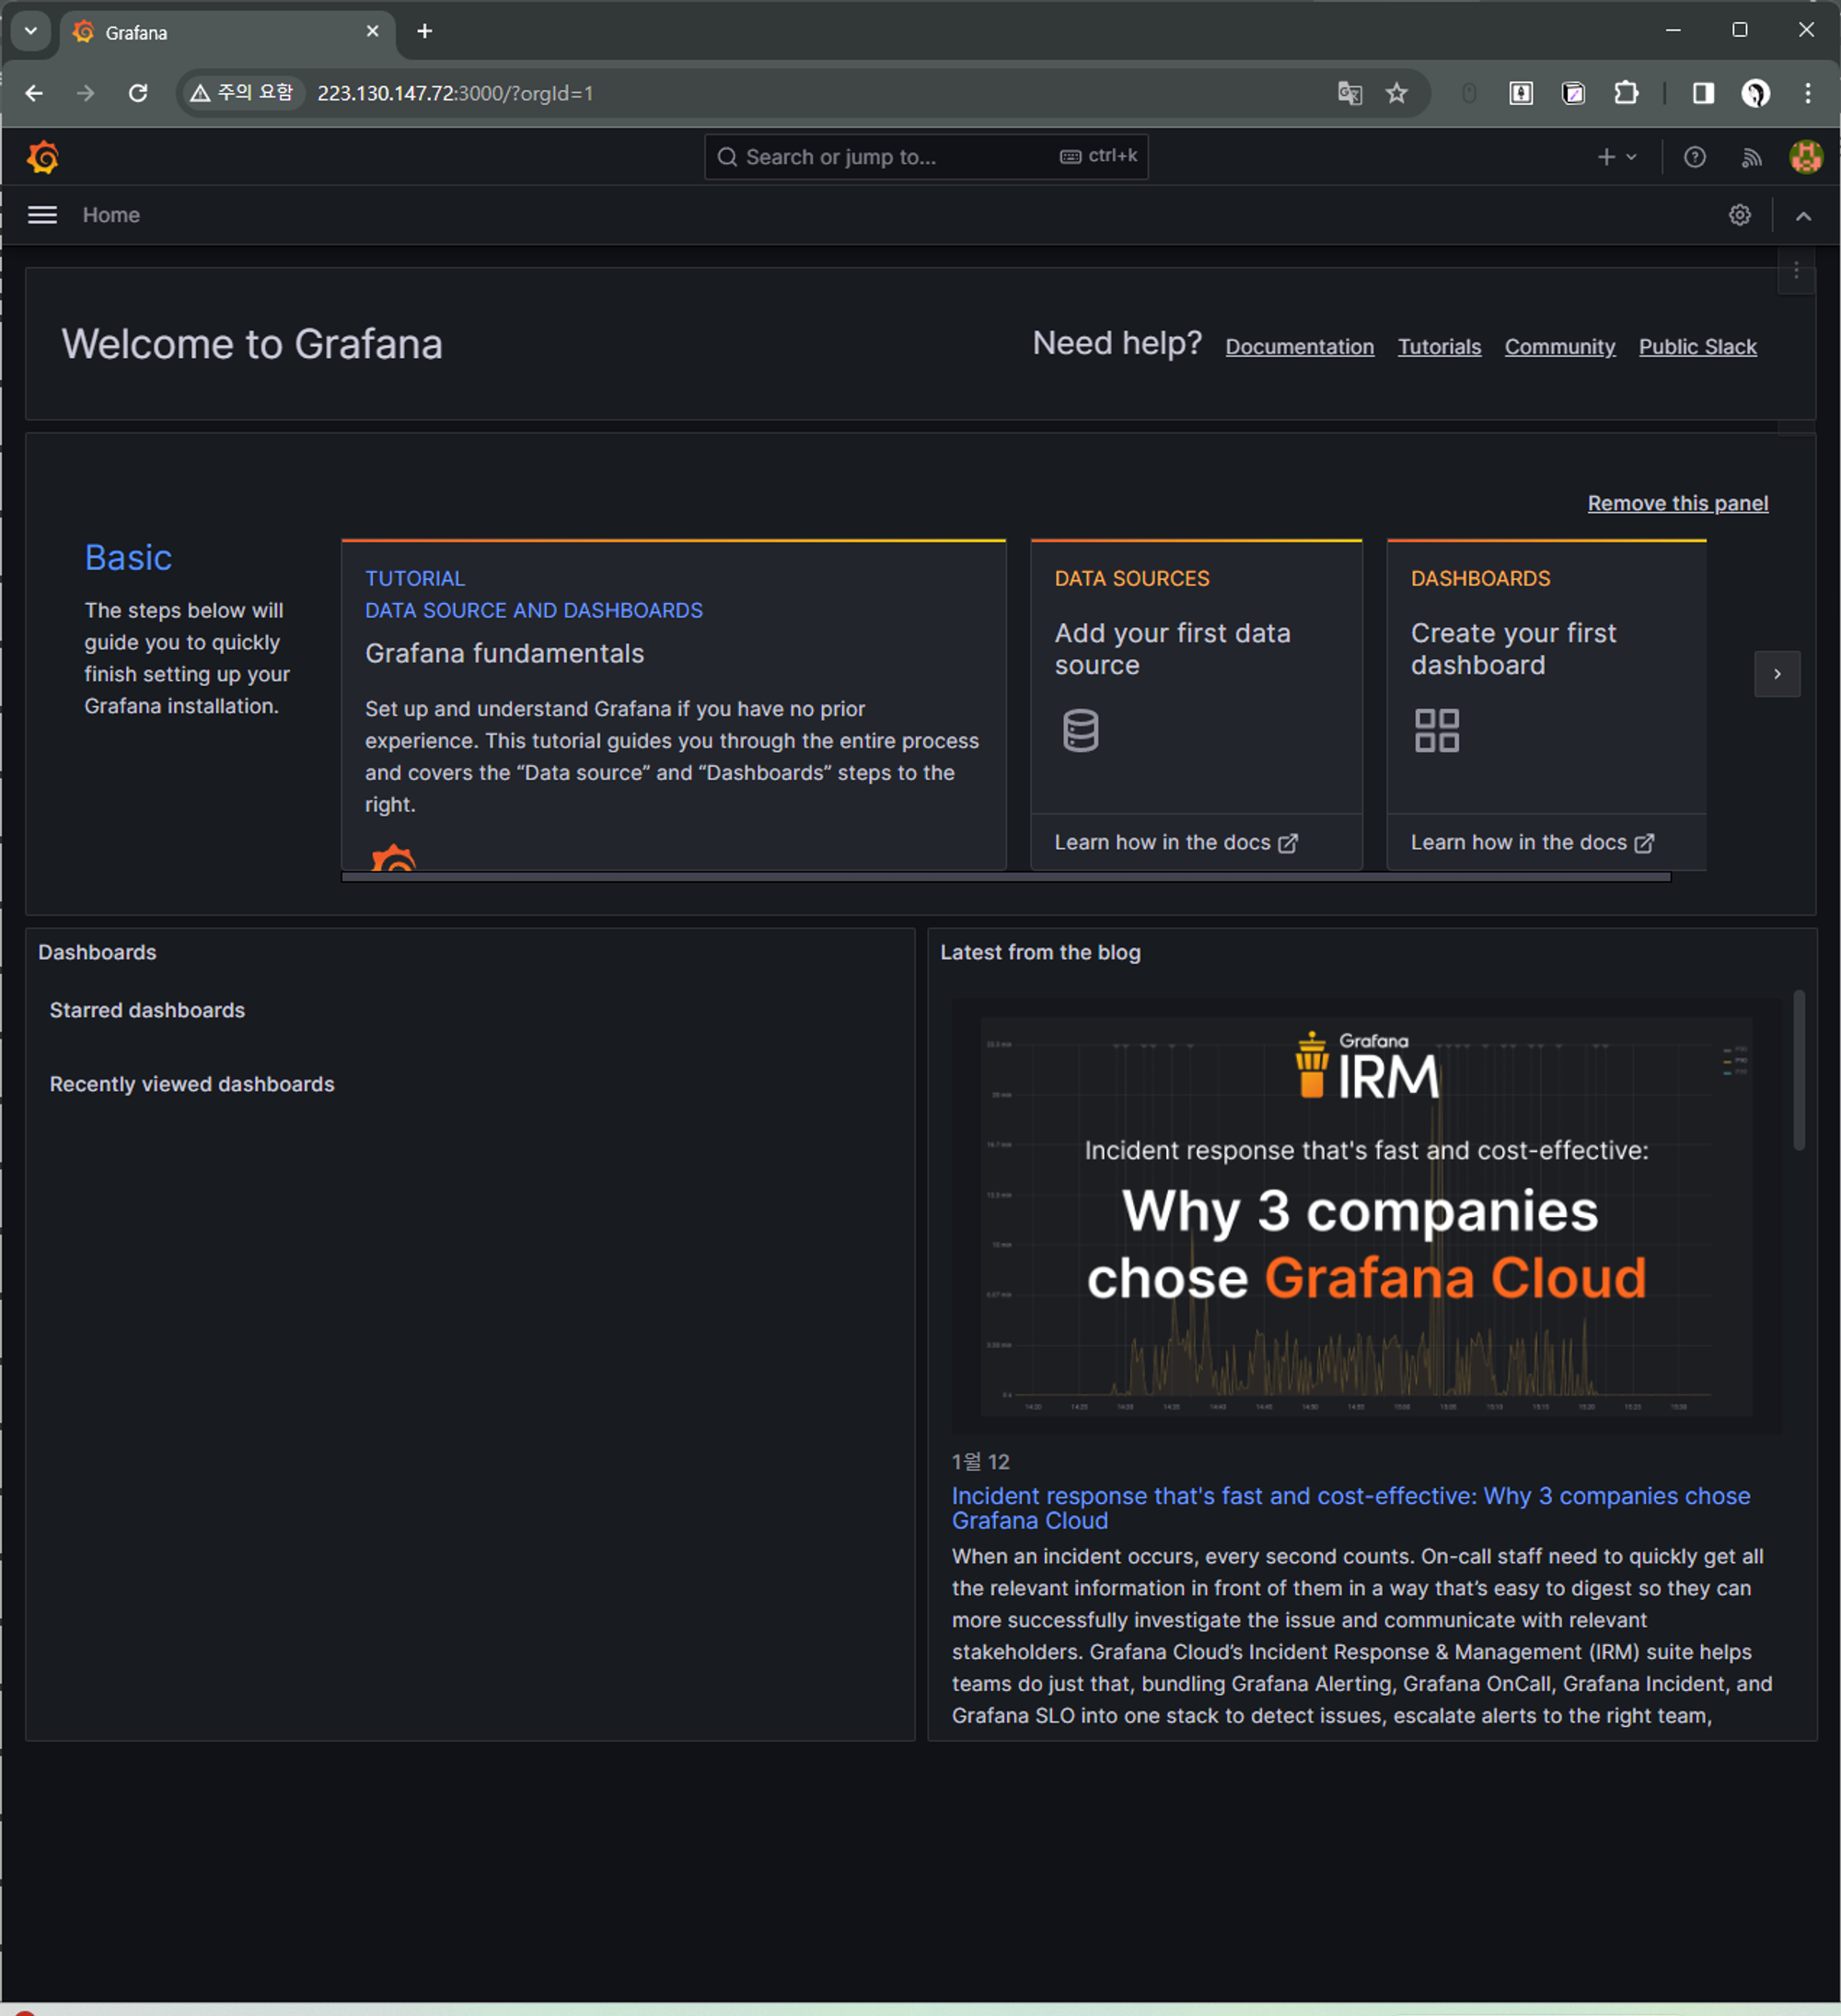
grafana 설치
mkdir /tmp/grafana
cd /tmp/grafana

# Grafana 설치
sudo yum install -y https://dl.grafana.com/enterprise/release/grafana-enterprise-10.2.3-1.x86_64.rpm

# Grafana 실행
systemctl start grafana-server.service
systemctl enable grafana-server.service
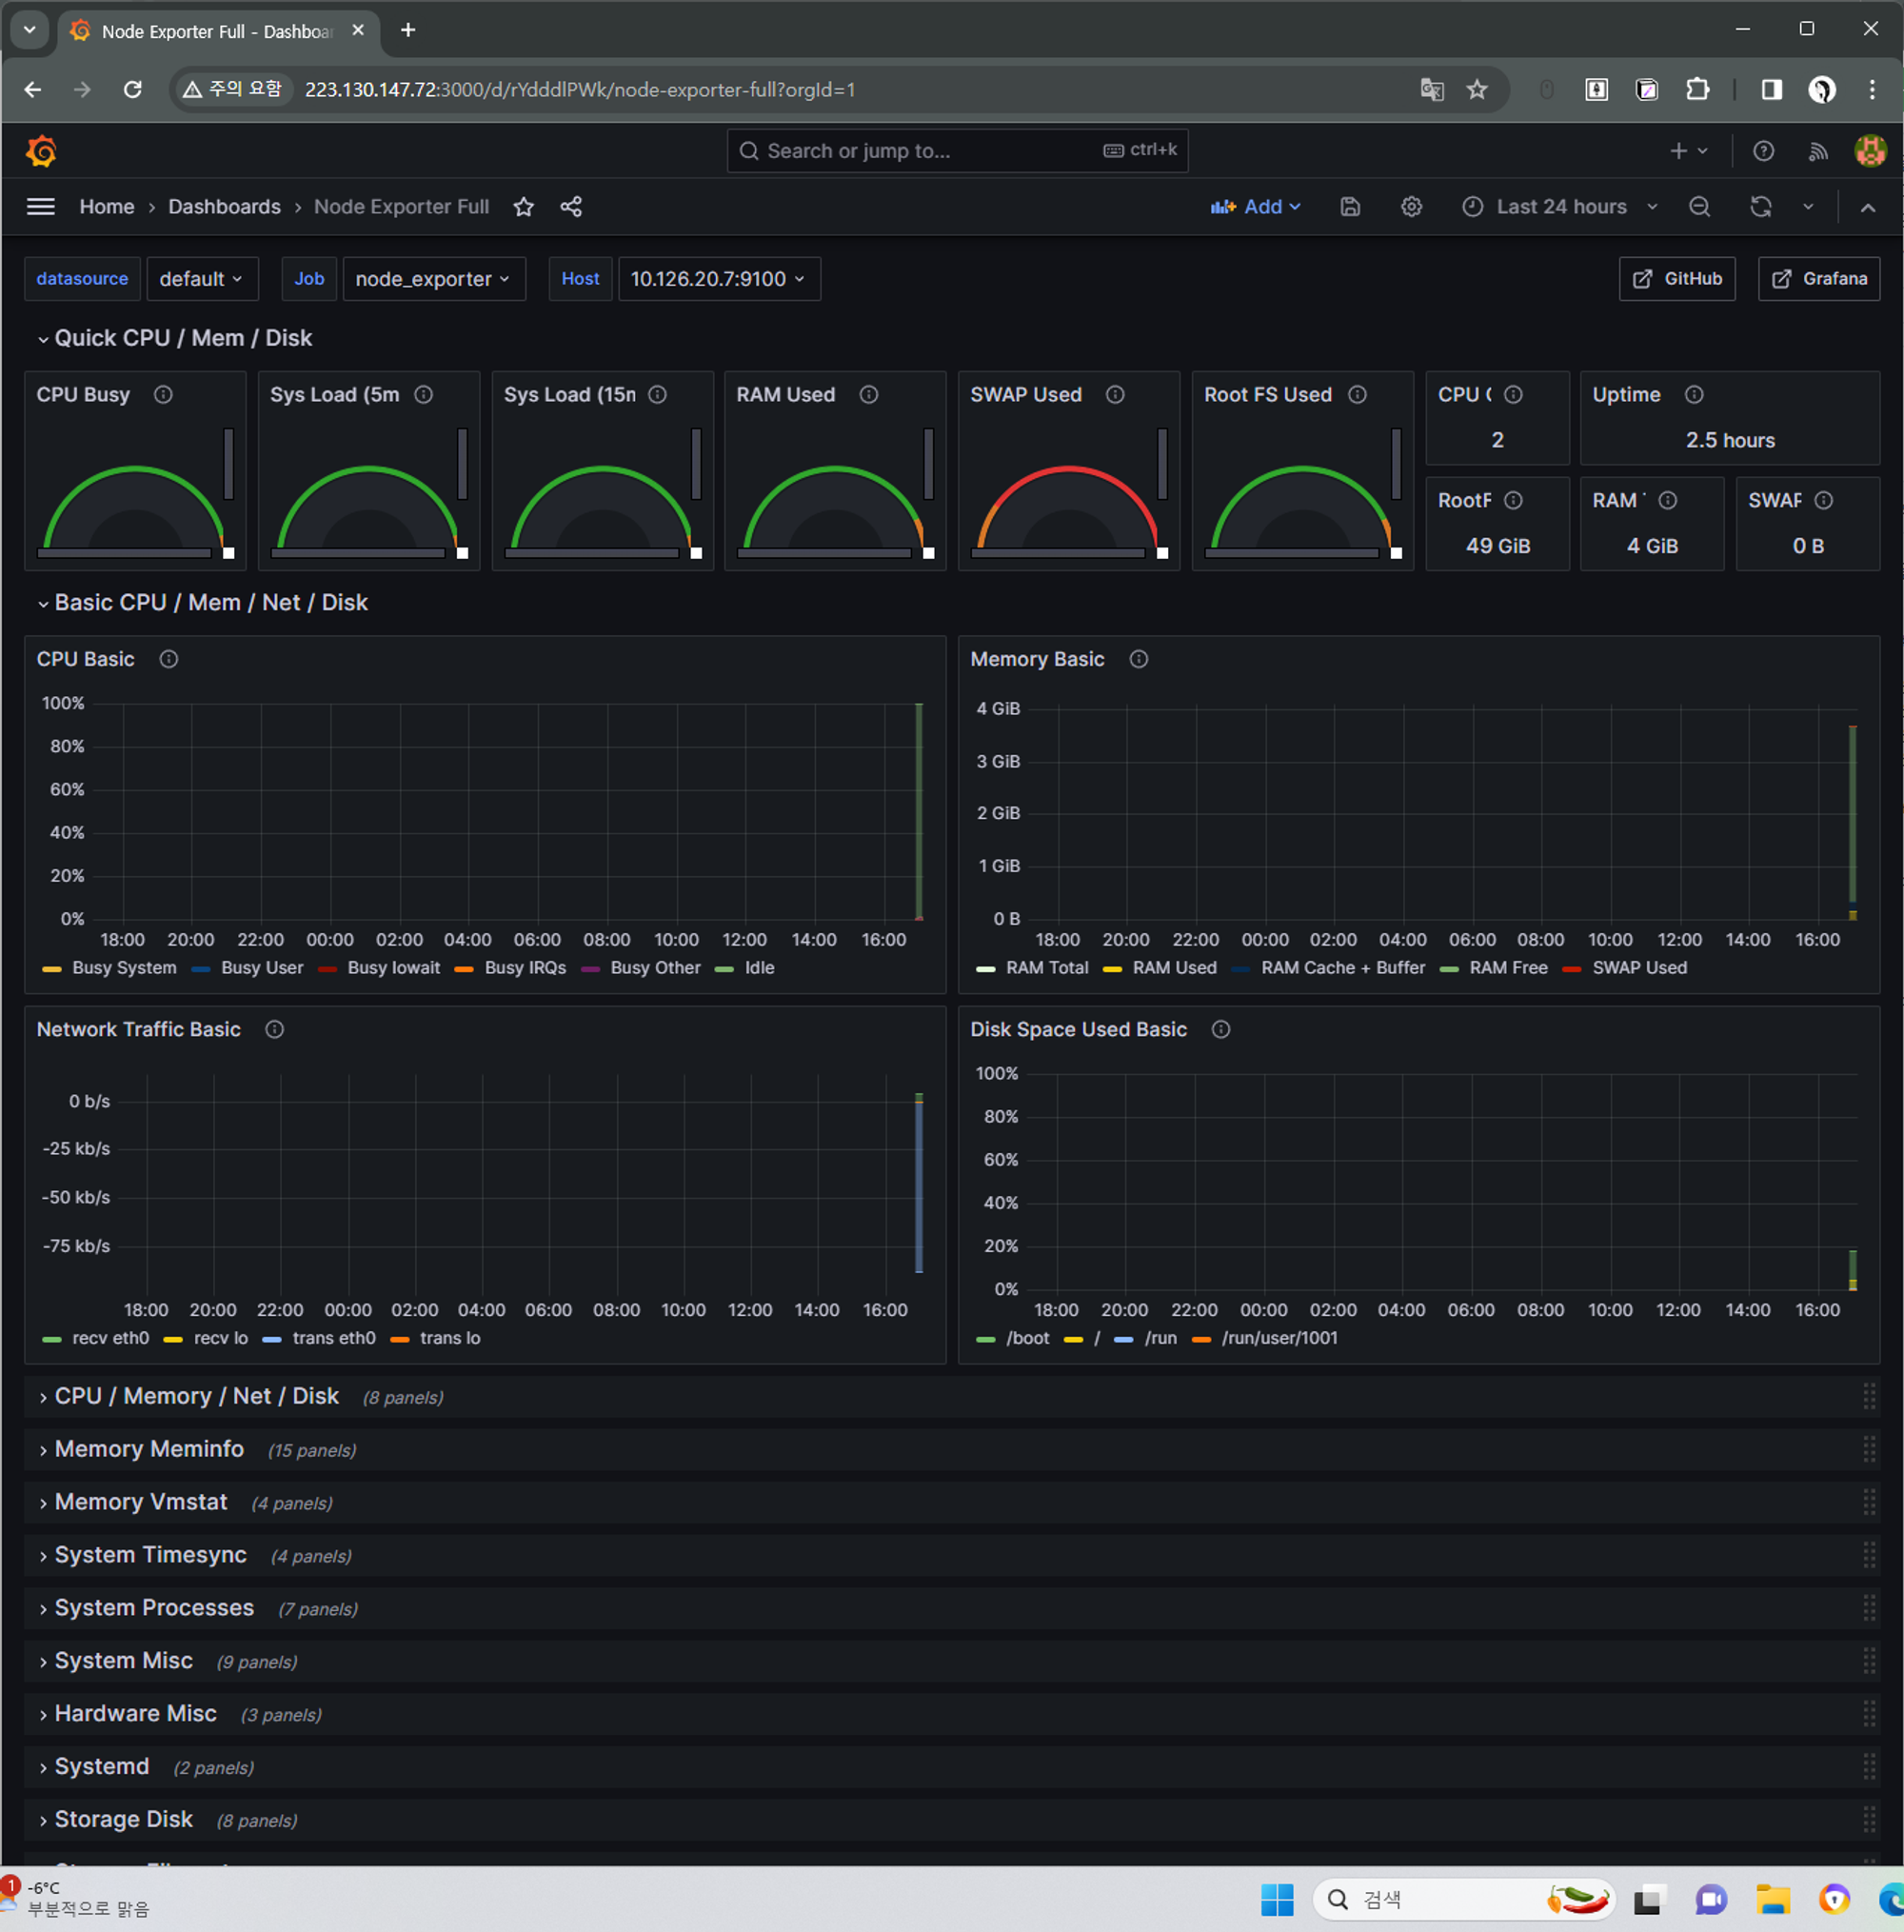
프로메테우스를 데이터소스로 그라파나 대시보드 구성
[public acg] grafana, node exporter, prometheus 포트 열기
접속: http://[공인IP]:3000
Dashboard : 1860
Grafana의 데이터소스로 Prometheus 추가
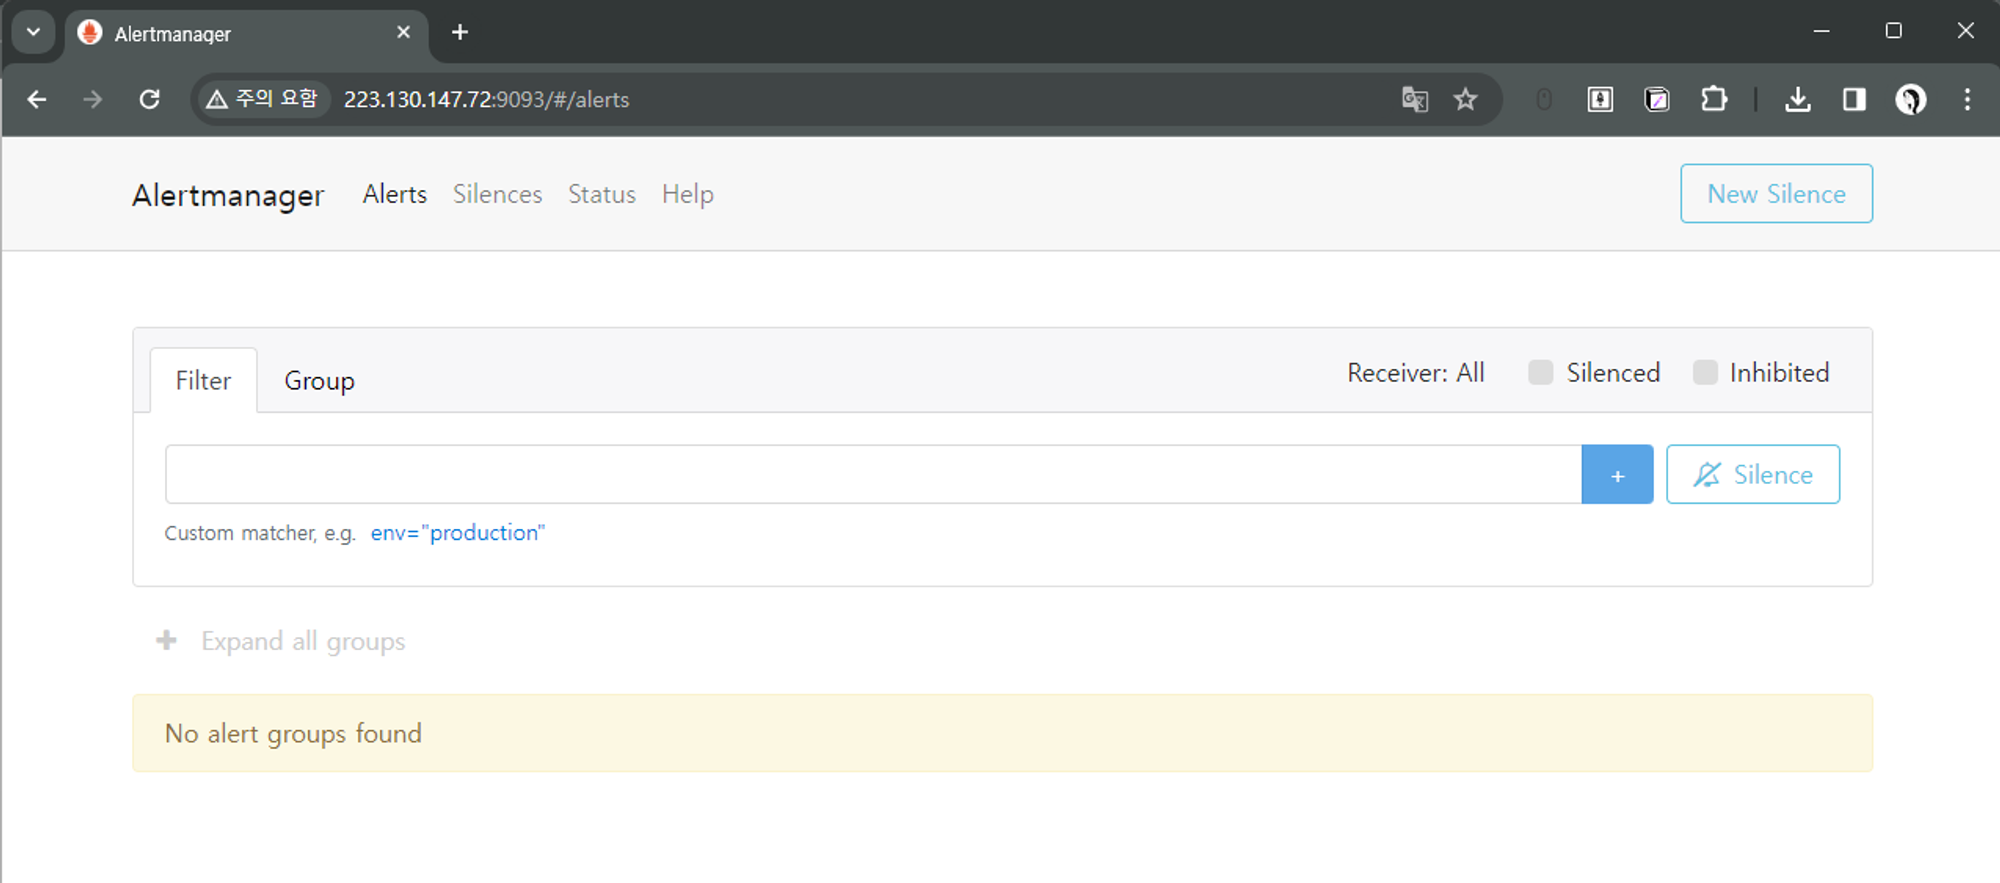
Alertmanager - slack 연동
slack 수신 웹후크 추가
webhook 테스트
vi alertmanager.yml
global:
  slack_api_url: "https://hooks.slack.com/services/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"
  # Slack Web Hook URL 넣기

route:
  receiver: 'Slack id'
  group_by: ['alertTest']
  group_wait: 30s
  group_interval: 5s
  repeat_interval: 3h
  routes:
  - receiver: 'Slack id'
    group_wait: 10s
    match_re:
      service: dev

receivers:
- name: 'Slack id'
  slack_configs:
  - channel: "test" # slack Channel ID or Slack ID
    username: "daun"
    title: 'Emergency '  # Title 제목
    text: "summary: {{ .CommonAnnotations.summary }}\ndescription: {{ .CommonAnnotations.description }}"  # 내용 Text
#templates:
#- './slack.tmpl'  # slack Hook Template
vi alert_rules.yml
- InstanceDown: 인스턴스의 상태가 up이 아닌 경우
- HostOutOfMemory: 사용가능한 메모리의 백분율이 10% 미만인 경우
- HostMemoryUnderMemoryPressure: 1분 동안의 주요 페이지 폴트 비율이 1000 초과인 경우
- HostOutOfDiskSpace: 파일 시스템의 여유 공간이 10% 미만이고, 파일 시스템이 읽기 전용이 아닌 경우
- HostHighCpuLoad: CPU 공간이 80%를 초과하는 경우
groups:
- name: alert.rules
  rules:
  - alert: InstanceDown
    expr: up == 0
    for: 1m
    labels:
      severity: "critical"
    annotations:
      summary: "Endpoint {{ $labels.instance }}"
      identifier: "{{ $labels.instance }}"
      description: "{{ $labels.instance }} of job {{ $labels.job }} has been down for more than 1 minutes."

  - alert: HostOutOfMemory
    expr: node_memory_MemAvailable_bytes / node_memory_MemTotal_bytes * 100 < 10
    for: 2m
    labels:
      severity: warning
    annotations:
      summary: "Host out of memory (instance {{ $labels.instance }})"
      description: "Node memory is filling up (< 10% left)\n  VALUE = {{ $value }}\n  LABELS: {{ $labels }}"

  - alert: HostMemoryUnderMemoryPressure
    expr: rate(node_vmstat_pgmajfault[1m]) > 1000
    for: 2m
    labels:
      severity: warning
    annotations:
      summary: "Host memory under memory pressure (instance {{ $labels.instance }})"
      description: "The node is under heavy memory pressure. High rate of major page faults\n  VALUE = {{ $value }}\n  LABELS: {{ $labels }}"
  # Please add ignored mountpoints in node_exporter parameters like
  # "--collector.filesystem.ignored-mount-points=^/(sys|proc|dev|run)($|/)".
  # Same rule using "node_filesystem_free_bytes" will fire when disk fills for non-root users.
  - alert: HostOutOfDiskSpace
    expr: (node_filesystem_avail_bytes * 100) / node_filesystem_size_bytes < 10 and ON (instance, device, mountpoint) node_filesystem_readonly == 0
    for: 2m
    labels:
      severity: warning
    annotations:
      summary: "Host out of disk space (instance {{ $labels.instance }})"
      description: "Disk is almost full (< 10% left)\n  VALUE = {{ $value }}\n  LABELS: {{ $labels }}"

  - alert: HostHighCpuLoad
    expr: 100 - (avg by(instance) (rate(node_cpu_seconds_total{mode="idle"}[2m])) * 100) > 80
    for: 0m
    labels:
      severity: warning
    annotations:
      summary: "Host high CPU load (instance {{ $labels.instance }})"
      description: "CPU load is > 80%\n  VALUE = {{ $value }}\n  LABELS: {{ $labels }}"
prometheus 실행파일이 있는 위치에서 rule파일이 잘 작동하는지 확인
./promtool check rules ./rules/alert_rules.yml
vi prometheus.yml 수정
alerting:
  alertmanagers:
    - static_configs:
      - targets:
        - localhost:9093
          # - alertmanager:9093

# Load rules once and periodically evaluate them according to the global 'evaluation_interval'.
rule_files:
  - "rules/alert_rules.yml"

Alert 발생하기 위한 테스트
#오라클 클라우드의 node export를 정지시킴
sudo systemctl stop prometheus-node.service

'교육' 카테고리의 다른 글
| [Ncloud] Onpremise - Ncloud IPSecVPN 연동 (0) | 2024.01.17 |
|---|---|
| [Ncloud] IPsec VPN (Ncloud-Oracle cloud(OCI)) (0) | 2024.01.15 |
| [AWS] S3, CloudFront (0) | 2024.01.09 |
| [AWS] Auto Scaling 실습 (0) | 2024.01.08 |
| [NCP_실습] NKS (0) | 2023.12.12 |


